1
2
3
4
5
6
7
8
9
10
11
12
13
14
15
16
17
18
19
20
21
22
23
24
25
26
27
28
29
30
31
32
33
34
35
36
37
38
39
40
41
42
43
44
45
46
47
48
49
50
51
52
53
54
55
56
57
58
59
60
61
62
63
| $(function () {
var chart = new Highcharts.Chart({
chart: {
renderTo: 'container',
type: 'line'
},
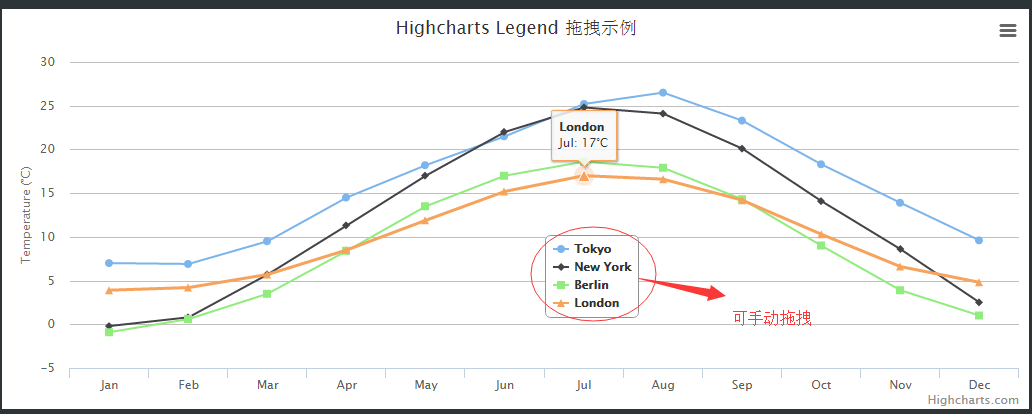
title: {
text: 'Highcharts Draggable Legend Demo'
},
xAxis: {
categories: ['Jan', 'Feb', 'Mar', 'Apr', 'May', 'Jun',
'Jul', 'Aug', 'Sep', 'Oct', 'Nov', 'Dec'],
labels: {
zIndex: 6
}
},
yAxis: {
title: {
text: 'Temperature (°C)'
},
plotLines: [{
value: 0,
width: 1,
color: '#808080'
}],
labels: {
zIndex: 6
}
},
tooltip: {
formatter: function () {
return '<b>' + this.series.name + '</b><br/>' + this.x + ': ' + this.y + '°C';
}
},
legend: {
layout: 'vertical',
backgroundColor: 'white',
align: 'right',
verticalAlign: 'top',
y: 165,
x: -220,
borderWidth: 1,
borderRadius: 5,
floating: true,
draggable: true,
zIndex: 20
},
series: [{
name: 'Tokyo',
data: [7.0, 6.9, 9.5, 14.5, 18.2, 21.5, 25.2, 26.5, 23.3, 18.3, 13.9, 9.6]
}, {
name: 'New York',
data: [-0.2, 0.8, 5.7, 11.3, 17.0, 22.0, 24.8, 24.1, 20.1, 14.1, 8.6, 2.5]
}, {
name: 'Berlin',
data: [-0.9, 0.6, 3.5, 8.4, 13.5, 17.0, 18.6, 17.9, 14.3, 9.0, 3.9, 1.0]
}, {
name: 'London',
data: [3.9, 4.2, 5.7, 8.5, 11.9, 15.2, 17.0, 16.6, 14.2, 10.3, 6.6, 4.8]
}]
});
});
|