1
2
3
4
5
6
7
8
9
10
11
12
13
14
15
16
17
18
19
20
21
22
23
24
25
26
27
28
29
30
31
32
33
34
35
36
37
38
39
40
41
42
43
44
45
46
47
48
49
50
51
52
53
54
55
56
57
58
59
60
61
62
63
64
65
66
67
68
69
70
71
72
73
74
75
76
77
78
79
80
81
82
83
84
85
86
87
88
| function showDetails(t)
{
$.ajax({
type: "GET",
dataType: 'json',
cache: false,
data: "",
url: window.location.href+"?action=GetDetailData",
beforeSend: function () {
},
success: function (result) {
$.dialog({
id: "BigImg",
esc: true,
content: '<div style="height:' + $(window).height() * 0.70 + 'px;"><div id="div_big_img"></div></div>',
width: $(window).width() * 0.62,
height: $(window).height() * 0.70,
title: '数据明细',
init: function () {
$('#div_big_img').highcharts({
chart: {
type: 'column',
width:600,
height:400,
margin: [ 50, 50, 100, 80]
},
title: {
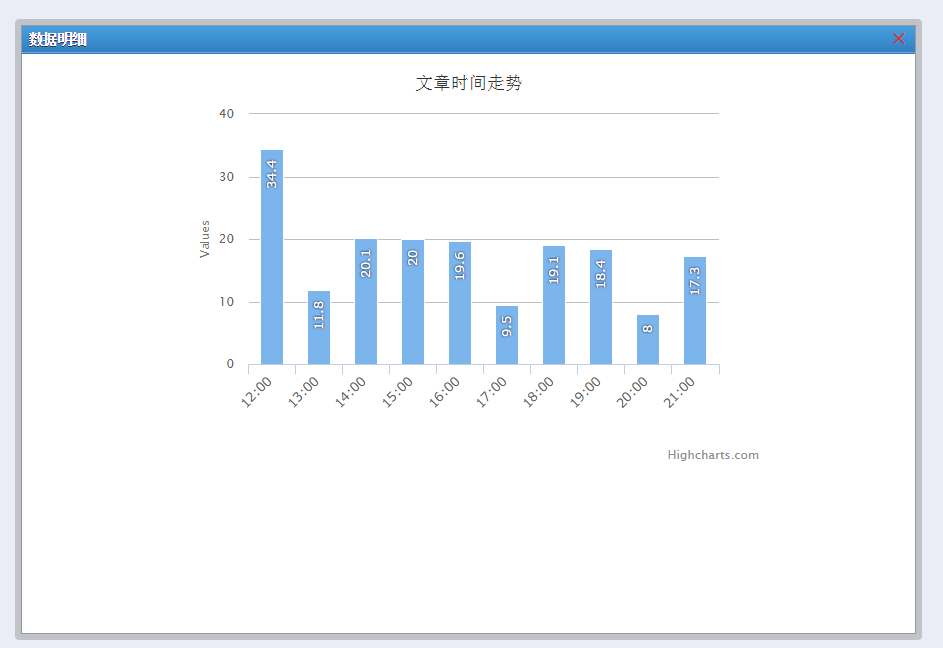
text: '文章时间走势'
},
xAxis: {
categories: [
'12:00',
'13:00',
'14:00',
'15:00',
'16:00',
'17:00',
'18:00',
'19:00',
'20:00',
'21:00'
],
labels: {
rotation: -45,
align: 'right',
style: {
fontSize: '13px',
fontFamily: 'Verdana, sans-serif'
}
}
},
legend: {
enabled: false
},
tooltip: {
pointFormat: "Population in 2008: <b>{point.y:.1f} millions</b>",
},
series: [{
name: 'Population',
data: [34.4, 11.8, 20.1, 20, 19.6, 9.5, 19.1, 18.4, 8, 17.3],
dataLabels: {
enabled: true,
rotation: -90,
color: '#FFFFFF',
align: 'right',
x: 4,
y: 10,
style: {
fontSize: '13px',
fontFamily: 'Verdana, sans-serif',
textShadow: '0 0 3px black'
}
}
}]
});
},
max: false,
min: false,
fixed: true,
lock: true
});
}
});
}
|