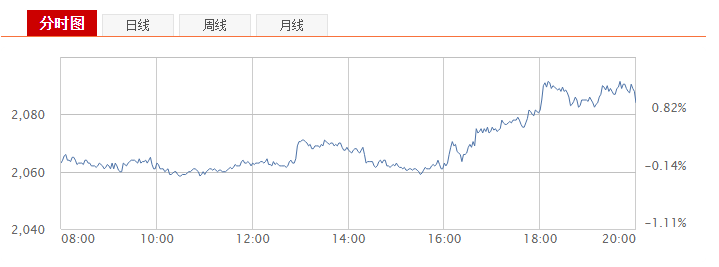
highchart 自定义事件插件

highchart 插件之自定义事件

下面是扩展插件的代码

1
2
3
4
5
6
7
8
9
10
11
12
13
14
15
16
17
18
19
20
21
22
23
24
25
26
27
28
29
30
31
32
33
34
35
36
37
38
39
40
41
42
43
44
45
46
47
48
49
50
51
52
53
54
55
56
57
58
59
60
61
62
63
64
65
66
67
68
69
70
71
72
73
74
75
76
77
78
79
80
81
82
83
84
85
86
87
88
89
90
91
92
93
94
95
96
97
98
99
100
101
102
103
104
105
106
107
108
109
110
111
112
113
114
115
116
117
118
119
120
121
122
123
124
125
126
127
128
129
130
131
132
133
134
135
136
137
138
139
140
141
142
143
144
145
146
147
148
149
150
151
152
153
154
155
156
157
158
159
160
161
162
163
164
165
166
167
168
169
170
171
172
173
174
175
176
177
178
179
180
181
182
183
184
185
186
187
188
189
190
191
192
193
194
195
196
197
198
199
200
201
202
203
204
205
206
207
208
209
210
211
212
213
214
215
216
217
218
219
220
(function (HC) {
/*jshint expr:true, boss:true */
var UNDEFINED;
//reseting all events, fired by Highcharts
HC.Chart.prototype.callbacks.push(function (chart) {
var resetAxisEvents = chart.customEvent.resetAxisEvents,
series = chart.series,
serLen = series.length,
xAxis = chart.xAxis,
yAxis = chart.yAxis,
i = 0;

resetAxisEvents(xAxis, 'xAxis', chart);
resetAxisEvents(yAxis, 'yAxis', chart);

for (; i < serLen; i++) {
series[i].update({
customEvents: {
series: series[i].options.events,
point: series[i].options.point.events
},
events: {
click: null
},
point: {
events: {
click: null
}
}
},false);
}

chart.xAxis[0].isDirty = true;
chart.redraw();
});

//custom event body
var customEvent = HC.Chart.prototype.customEvent = function (obj, proto) {
customEvent.add = function (elem, events, obj) {
for (var key in events) {

(function (key) {
if (events.hasOwnProperty(key)) {
if(!elem[key] || elem[key] === UNDEFINED) {
HC.addEvent(elem.element, key, function (e) {
events[key].call(obj, e);
return false;
});
}

elem[key] = true;
}
})(key)

}
};

HC.Chart.prototype.customEvent.resetAxisEvents = function(axis, type, chart) {
var axisLength = axis.length,
userOptions = chart.userOptions,
i = 0,
j = 0,
redraw = false,
customEvents, plotBandsLength, plotLinesLength, plotLines, plotBands,cAxis;

for(;i<axisLength;i++) {

if(type === 'xAxis' && userOptions.xAxis !== UNDEFINED) {

cAxis = HC.splat(userOptions.xAxis);
plotLines = cAxis[i].plotLines;
plotBands = cAxis[i].plotBands;

} else if(type === 'yAxis' && userOptions.yAxis !== UNDEFINED) {

cAxis = HC.splat(userOptions.yAxis);
plotLines = cAxis[i].plotLines;
plotBands = cAxis[i].plotBands;
}

if(plotLines !== UNDEFINED) {
plotLinesLength = plotLines.length;

for(j=0;j<plotLinesLength;j++){
var t = plotLines[j].events;
if(t) {
plotLines[j].customEvents = t;
plotLines[j].events = null;
}
};

redraw = true;
}

if(plotBands !== UNDEFINED) {
plotBandsLength = plotBands.length;

for(j=0;j<plotBandsLength;j++) {
var t = plotBands[j].events;
if(t) {
plotBands[j].customEvents = t;
plotBands[j].events = null;
}
};

redraw = true;
}

if(redraw) {
chart.yAxis[i].update({
plotLines: plotLines,
plotBands: plotBands
},false);
}
};
};


HC.wrap(obj, proto, function (proceed) {
var events,
element,
eventsPoint,
elementPoint,
op;

//call default actions
proceed.apply(this, Array.prototype.slice.call(arguments, 1));

//switch on object
switch (proto) {
case 'addLabel':
events = this.axis.options.labels.events;
element = this.label;
break;
case 'setTitle':
events = this.options.title.events;
element = this.title;
break;
case 'drawDataLabels':
events = this.dataLabelsGroup ? this.options.dataLabels.events : null;
element = this.dataLabelsGroup ? this.dataLabelsGroup : null;
break;
case 'render':
if (this.axisTitle) {
events = this.options.title.events;
element = this.axisTitle;
}
if (this.options.value || this.options.from) {
events = this.options.customEvents;
element = this.svgElem;
}
break;
case 'drawPoints':
op = this.options;
events = op.customEvents ? op.customEvents.series : op,
element = this.group;
eventsPoint = op.customEvents ? op.customEvents.point : op.point.events;
elementPoint = this.points;
break;
case 'renderItem':
events = this.options.itemEvents;
element = this.group;
break;
}


if (events || eventsPoint) {

if (eventsPoint) {
var len = elementPoint.length
j = 0;

for (; j < len; j++) {
var elemPoint = elementPoint[j].graphic;

if (elementPoint[j].y && elemPoint !== UNDEFINED) {
customEvent.add(elemPoint, eventsPoint, elementPoint[j]);
}
}
}

customEvent.add(element, events, this);
}


});
};

//labels
customEvent(HC.Tick.prototype, 'addLabel');

//axis
//title
customEvent(HC.Axis.prototype, 'render');
//plotbands + plotlines
customEvent(HC.PlotLineOrBand.prototype, 'render');

//series events & point events
customEvent(HC.Series.prototype, 'drawPoints');
customEvent(HC.seriesTypes.column.prototype, 'drawPoints');
customEvent(HC.seriesTypes.pie.prototype, 'drawPoints');

//datalabels events
customEvent(HC.Series.prototype, 'drawDataLabels');
customEvent(HC.seriesTypes.column.prototype, 'drawDataLabels');
customEvent(HC.seriesTypes.pie.prototype, 'drawDataLabels');

//title events
customEvent(HC.Chart.prototype, 'setTitle');

//legend items
customEvent(HC.Legend.prototype, 'renderItem');

//bubble charts
if(HC.seriesTypes.bubble) {
customEvent(HC.seriesTypes.bubble.prototype, 'drawPoints');
customEvent(HC.seriesTypes.bubble.prototype, 'drawDataLabels');
}

})(Highcharts);

查看更多

highchart legend 可拖拽扩展

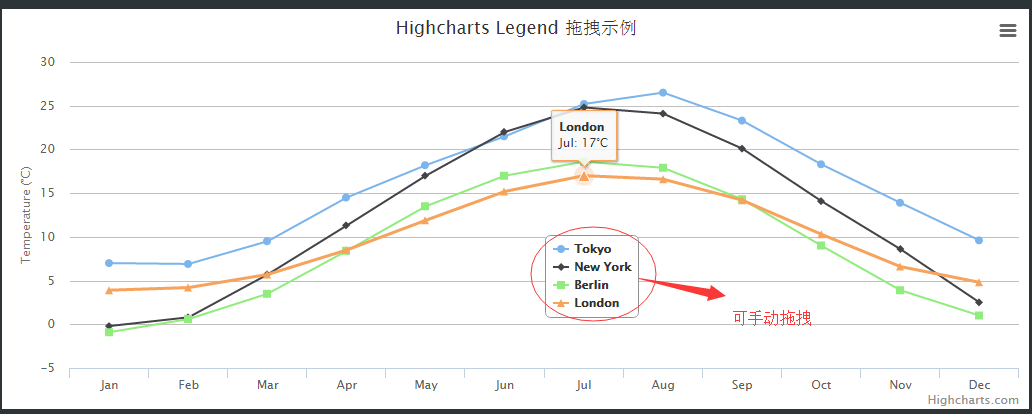
highchart 插件之legend 拖拽扩展

下面是扩展插件的代码

1
2
3
4
5
6
7
8
9
10
11
12
13
14
15
16
17
18
19
20
21
22
23
24
25
26
27
28
29
30
31
32
33
34
35
36
37
38
39
40
41
42
43
44
45
46
47
48
49
50
51
52
53
54
55
56
57
58
59
60
(function (H) {
var addEvent = H.addEvent;

H.wrap(H.Chart.prototype, 'init', function (proceed) {
proceed.apply(this, Array.prototype.slice.call(arguments, 1));

var chart = this,
legend = chart.legend,
box = legend.box,
options = legend.options,
isDragging,
downX,
downY,
optionsX,
optionsY,
currentX,
currentY;
if (options.draggable) {
box.css({
cursor: 'move'
});
addEvent(box.element, 'mousedown', function (e) {
e = chart.pointer.normalize(e);
downX = e.chartX;
downY = e.chartY;
optionsX = options.x;
optionsY = options.y;
currentX = legend.group.attr('translateX');
currentY = legend.group.attr('translateY');
isDragging = true;
});
addEvent(chart.container, 'mousemove', function (e) {
if (isDragging) {
e = chart.pointer.normalize(e);
var draggedX = e.chartX - downX,
draggedY = e.chartY - downY;

options.x = optionsX + draggedX;
options.y = optionsY + draggedY;

// Do the move is we're inside the chart
if (currentX + draggedX > 0 && currentX + draggedX + legend.legendWidth < chart.chartWidth && currentY + draggedY > 0 && currentY + draggedY + legend.legendHeight < chart.chartHeight) {
legend.group.placed = false; // prevent animation
legend.group.align(H.extend({
width: legend.legendWidth,
height: legend.legendHeight
}, options), true, 'spacingBox');
}
if (chart.pointer.selectionMarker) {
chart.pointer.selectionMarker = chart.pointer.selectionMarker.destroy();
}

}
});
addEvent(document, 'mouseup', function () {
isDragging = false;
});
}
});
}(Highcharts));

前端初始化代码

1
2
3
4
5
6
7
8
9
10
11
12
13
14
15
16
17
18
19
20
21
22
23
24
25
26
27
28
29
30
31
32
33
34
35
36
37
38
39
40
41
42
43
44
45
46
47
48
49
50
51
52
53
54
55
56
57
58
59
60
61
62
63
$(function () {
var chart = new Highcharts.Chart({
chart: {
renderTo: 'container',
type: 'line'
},
title: {
text: 'Highcharts Draggable Legend Demo'
},
xAxis: {
categories: ['Jan', 'Feb', 'Mar', 'Apr', 'May', 'Jun',
'Jul', 'Aug', 'Sep', 'Oct', 'Nov', 'Dec'],
labels: {
zIndex: 6
}
},
yAxis: {
title: {
text: 'Temperature (°C)'
},
plotLines: [{
value: 0,
width: 1,
color: '#808080'
}],
labels: {
zIndex: 6
}
},
tooltip: {
formatter: function () {
return '<b>' + this.series.name + '</b><br/>' + this.x + ': ' + this.y + '°C';
}
},
legend: {
layout: 'vertical',
backgroundColor: 'white',
align: 'right',
verticalAlign: 'top',
y: 165,
x: -220,
borderWidth: 1,
borderRadius: 5,

floating: true,
draggable: true,
zIndex: 20
},
series: [{
name: 'Tokyo',
data: [7.0, 6.9, 9.5, 14.5, 18.2, 21.5, 25.2, 26.5, 23.3, 18.3, 13.9, 9.6]
}, {
name: 'New York',
data: [-0.2, 0.8, 5.7, 11.3, 17.0, 22.0, 24.8, 24.1, 20.1, 14.1, 8.6, 2.5]
}, {
name: 'Berlin',
data: [-0.9, 0.6, 3.5, 8.4, 13.5, 17.0, 18.6, 17.9, 14.3, 9.0, 3.9, 1.0]
}, {
name: 'London',
data: [3.9, 4.2, 5.7, 8.5, 11.9, 15.2, 17.0, 16.6, 14.2, 10.3, 6.6, 4.8]
}]
});
});

效果图

demo在线预览

Highcharts部分图表圆角显示

highchart 插件之给column和bar 圆角

下面是扩展插件的代码

1
2
3
4
5
6
7
8
9
10
11
12
13
14
15
16
17
18
19
20
21
22
23
24
25
26
27
28
29
30
31
32
33
34
35
36
37
38
39
40
41
42
43
44
45
46
47
48
49
(function (H) {
H.wrap(H.seriesTypes.column.prototype, 'translate', function (proceed) {
var options = this.options,
rTopLeft = options.borderRadiusTopLeft || 0,
rTopRight = options.borderRadiusTopRight || 0,
rBottomRight = options.borderRadiusBottomRight || 0,
rBottomLeft = options.borderRadiusBottomLeft || 0;

proceed.call(this);

if (rTopLeft || rTopRight || rBottomRight || rBottomLeft) {
H.each(this.points, function (point) {
var shapeArgs = point.shapeArgs,
w = shapeArgs.width,
h = shapeArgs.height,
x = shapeArgs.x,
y = shapeArgs.y;

// Preserve the box for data labels
point.dlBox = point.shapeArgs;

point.shapeType = 'path';
point.shapeArgs = {
d: [
'M', x + rTopLeft, y,
// top side
'L', x + w - rTopRight, y,
// top right corner
'C', x + w - rTopRight / 2, y, x + w, y + rTopRight / 2, x + w, y + rTopRight,
// right side
'L', x + w, y + h - rBottomRight,
// bottom right corner
'C', x + w, y + h - rBottomRight / 2, x + w - rBottomRight / 2, y + h, x + w - rBottomRight, y + h,
// bottom side
'L', x + rBottomLeft, y + h,
// bottom left corner
'C', x + rBottomLeft / 2, y + h, x, y + h - rBottomLeft / 2, x, y + h - rBottomLeft,
// left side
'L', x, y + rTopLeft,
// top left corner
'C', x, y + rTopLeft / 2, x + rTopLeft / 2, y, x + rTopLeft, y,
'Z'
]
};

});
}
});
}(Highcharts));

前端初始化代码

1
2
3
4
5
6
7
8
9
10
11
12
13
14
15
16
17
18
19
20
21
22
23
24
$(function () {
$('#container').highcharts({
chart: {
type: 'column'
},
xAxis: {
categories: ['Jan', 'Feb', 'Mar', 'Apr', 'May', 'Jun', 'Jul', 'Aug', 'Sep', 'Oct', 'Nov', 'Dec']
},

plotOptions: {
series: {
groupPadding: 0
}
},

series: [{
data: [29.9, 71.5, 106.4, 129.2, 144.0, 176.0, 135.6, 148.5, 216.4, 194.1, 95.6, 54.4],
borderRadiusTopLeft: 5,
borderRadiusTopRight: 5
//borderRadiusBottomRight: 10,
//borderRadiusBottomLeft: 10
}]
});
});

效果图

demo在线预览

highchart 点击图表弹出层展示新图表

人太懒了,都不想写描述了,直接上代码吧 o(∩_∩)o 哈哈

简要说明步骤

  • 页面先初始化一个图表
    初始化代码我就省略了…

  • 在plotOptions 里的series events 增加点击事件

    1
    2
    3
    4
    5
    6
    7
    8
    9
    10
    11
    12
    13
     plotOptions:{
    series: {
    cursor: "pointer",
    point: {
    events: {
    click: function () {
    //弹出方法 参数自己定义 需要什么传什么
    showDetails(this.category);
    }
    }
    }
    }
    }
  • 然后是弹出的方法,调用了lghdialog

查看更多

highchart+table 结合phantomjs 一并生成图片

其实是看到群里有小伙伴有这个需求,我才制作了这个DEMO,因为之前用phantomjs实现过纯后台导出图片,所以顺便改了下以前的DEMO分享给大家。
phantomjs 纯后台导出 请参考:http://www.peng8.net/2014/07/21/render-charts-serverside/

准备工作

  1. 去官网下载最新的phantomjs,官网提供三个版本下载,我电脑是window 7,所以用的是windows版,至于其他系统的请下载对应的版本。
  2. 解压文件,只需要对应的处理文件,例如windows版本里的就要 phantomjs.exerasterize.jsrasterize.js 用来向 phantomjs 发起请求生成快照

前端整理

  • 这里我们需要2个页面,一个页面用来专门显示图表(default),一个用来触发弹出图表(index)
    为什么我们需要2个页面呢?因为这里我们是用到了phantomjs的一个功能,生成快照!所以需要一个干净的页面,只有图表,图片生成的内容也就是我们想要生成最后样子的图片。
  • 我借用了lhgdialog 弹窗插件来弹出展现我们要生成的图表

查看更多

highchart 之放大显示的几种方式

可能大家对highchart的api不是很熟,分享几个higchart 放大化显示的几种方法,对api熟悉可以忽略本篇文章了。

第一种方式 通过设置渲染DIV的宽带来调整图表的大小

1
2
3
4
var chart=new Highcharts.Chart(option); //假设这是我们初始化的图表
$('#container').width(500);//这里重新设置container这个DIV的宽度
//接着我们调用chart对象的reflow()方法即可重新渲染图表的大小
chart.reflow();

查看更多

highchart 导出excel By Asp.net

为了照顾小伙伴,用asp.net 写了份highchart简单导出excel的例子,希望对大家有所帮助

  • highchart导出 excel,主要用到了内部的getCSV,将数据post到服务端,至于服务端怎么处理大家就可以可显神通了,我所指知道的一般可以用 POINPOIaspose微软com+组件等等

前端HTML

1
2
3
4
5
6
7
8
9
10
11
 <div>
<div class="main">
<div class="chart-container">
<div id="chart1" class="chart">
</div>
</div>
<p>
<input type="button" value="Export Excel" id="btnDownLoad" />
</p>
</div>
</div>

查看更多

Highcharts 扩展之多张图表合并生成一张图

highchart的导出需求中,我们做过单个图表的导出,生成单个图片,也做过多个图表同时导出,生成多张图片。但很少遇到这样一种情况,需要将客户端的图表同时导出,并合并生成在一张图片上。

今天为大家来highchart一个扩展,原理就是在一键导出的时候,根据highchart现有的API方法去获取每个图表的SVG图片信息,然后拼接好合并成一个svg,最后提交给后台进行处理,这个功能即可将多个图表生成在一张图片上,也可以一次请求到后台生成多个图片,但需要自己在后台做svg拆分,一个一个生成。

  • 步入正题,首先引入扩展部分的javascript代码到head标签区域,或者单独建一个js文件
    1
    2
    3
    4
    5
    6
    7
    8
    9
    10
    11
    12
    13
    14
    15
    16
    17
    18
    19
    20
    21
    Highcharts.getSVG = function (charts) {
    var svgArr = [],
    top = 0,
    width = 0;

    $.each(charts, function (i, chart) {

    var svg = chart.getSVG();
    svg = svg.replace('<svg', '<g transform="translate(0,' + top + ')" ');
    svg = svg.replace('</svg>', '</g>');
    //svg = svg.replace('<svg', '<zg ct=' + chart.options.chartype);
    //svg = svg.replace('</svg>', '</zg>');(这段注释的代码用来生成多个图片)

    top += chart.chartHeight;
    width = Math.max(width, chart.chartWidth);

    svgArr.push(svg);
    });

    return '<svg height="' + top + '" width="' + width + '" version="1.1" xmlns="http://www.w3.org/2000/svg">' + svgArr.join('') + '</svg>';
    };

查看更多

highchart通用配置文件及使用说明

使用 highcharts 已经有好几年的时间了,用过很多图表插件!例如 funsionchartdhtmlxChartjqPlotJS ChartsOpen Flash ChartFlot,在到国产最近比较好的 echarts ,这里面有基于javascript的,也有基于flash的,但最喜欢的还是 highcharts,这些图表插件基本的图表功能大部分都能满足,但区别在于图表的功能可扩展性及浏览器兼容性上,highcharts 有明显的优势。

配置文件介绍

  • 下面步入正题,给大家分享一个 highcharts 全局配置文件,其实也没什么,无非就是将通用api里的参数放在了一个方法里,这样初始化图表就不用每次都去写一大串配置,而是用到什么参数就写什么参数,具体请看下面这段javascript代码

    查看更多